Revista Electrónica Educare (Educare Electronic Journal) EISSN: 1409-4258 Vol. 26(3) SETIEMBRE-DICIEMBRE, 2022: 1-11
doi: https://doi.org/10.15359/ree.26-3.21
https://www.revistas.una.ac.cr/index.php/educare
educare@una.ac.cr
[Cierre de edición el 01 de Setiembre del 2022]
Real-time Boredom Evaluation Technique in College Students
Técnica para la evaluación del aburrimiento en tiempo real en estudiantes de nivel universitario
Técnica de avaliação do tédio em tempo real em estudantes universitários
Leonardo Garro-Mena
Universidad de Costa Rica
San José, Costa Rica
 https://orcid.org/0000-0002-7525-3470
Jenny Andrea Calderón-Castro
Pontificia Universidad Católica de Chile
Santiago, Chile
jencalca@gmail.com
 https://orcid.org/0000-0001-5711-0137
Recibido • Received • Recebido: 03 / 08 / 2020
Corregido • Revised • Revisado: 24 / 07 / 2022
Aceptado • Accepted • Aprovado: 21 / 08 / 2022
Abstract:
Introduction. Various studies have associated boredom in educational processes with a variety of negative effects. It is believed that boredom is caused by a failure in the environment to fulfill our need for motivation. Many tools (scales) have been developed to measure it. However, these scales are designed to measure global boredom, that is, at the end of the process, not in its stages. The present study seeks to develop a methodology to evaluate the effect of boredom in the stages of a university class to have a tool for the quantitative evaluation of specific activities. Method. This study proposed a boredom measurement scale with a minimally disruptive intervention tool. The data obtained undergo mathematical processing to reduce the effect of subjectivity (perceived level of boredom) on the scale. The proposed methodology was applied to a group of students from the University of Costa Rica. Results. The most important result was the correlation between specific activities in a class and the gradient of boredom. Discussion. The reduction in the variability between students achieved with mathematical processing allows the proposed methodology to be used for the quantitative analysis of the stages of a class based on perceived boredom. This information can be used to design learning processes focused not only on the global process but on each stage of it, which, to the best of our knowledge, is not achieved by any of the commonly used scales.
Keywords: Boredom; boredom scale; learning; teaching.
Resumen:
Introducción. El aburrimiento en los procesos educativos ha sido asociado en diversos estudios con variedad de efectos negativos. Se cree que el aburrimiento es causado por una falla del entorno para satisfacer nuestra necesidad de excitación. Muchas herramientas (escalas) han sido desarrolladas para su medición; sin embargo, dichas escalas están diseñadas para la medición del aburrimiento global, es decir, al final del proceso, no en las etapas de este. El presente estudio busca desarrollar una metodología para evaluar el efecto del aburrimiento en las etapas de una clase universitaria, con el fin de contar con una herramienta para la evaluación cuantitativa de actividades específicas. Metodología. Se propone una escala de medición del aburrimiento junto con una herramienta de intervención mínimamente disruptiva. Los datos así obtenidos se someten a un procesamiento matemático con el propósito de reducir el efecto de la subjetividad (percepción del nivel de aburrimiento) en la escala. La metodología propuesta se aplicó a un grupo de estudiantes de la Universidad de Costa Rica. Resultados. El resultado más importante fue la correlación entre actividades específicas en una clase y el gradiente de aburrimiento. Discusión. La reducción en la variabilidad interestudiantil lograda con el procesamiento matemático permite que la metodología propuesta sea utilizada para el análisis cuantitativo de las etapas de una clase en función del aburrimiento percibido. Dicha información se puede utilizar para el diseño de procesos de aprendizaje centrados, no solo en el proceso global, sino en cada etapa de este, lo cual, a nuestro mejor entender, no logra ninguna de las escalas comúnmente utilizadas.
Palabras clave: Aburrimiento; escalas de aburrimiento; aprendizaje; enseñanza.
Resumo:
Introdução. O tédio nos processos educacionais tem sido associado em vários estudos a uma variedade de efeitos negativos. Acredita-se que o tédio seja causado por uma falha do ambiente em satisfazer nossa necessidade de excitação. Muitas ferramentas (escalas) foram desenvolvidas para sua medição, porém, essas escalas são projetadas para a medição do tédio global, ou seja, ao final do processo, não em suas etapas. O presente estudo busca desenvolver uma metodologia para avaliar o efeito do tédio nas etapas de uma aula universitária a fim de ter uma ferramenta para avaliação quantitativa de atividades específicas. Metodologia. Uma escala de medição do tédio é proposta em conjunto com uma ferramenta de intervenção minimamente disruptiva. Os dados assim obtidos são submetidos a processamento matemático para reduzir o efeito da subjetividade (nível percebido de tédio) na escala. A metodologia proposta foi aplicada a um grupo de estudantes da Universidade da Costa Rica. Resultados. O resultado mais importante foi a correlação entre atividades específicas em uma aula e o gradiente de tédio. Discussão. A redução da variabilidade entre alunos obtida com o processamento matemático permite que a metodologia proposta seja utilizada para a análise quantitativa das etapas de uma aula com base no tédio percebido. Essas informações podem ser utilizadas para o desenho de processos de aprendizagem focados não apenas no processo global, mas em cada etapa dele, o que, até onde sabemos, não é alcançado por nenhuma das escalas comumente utilizadas.
Palavras-chave: Tédio; escalas de tédio; aprendizagem; ensino.
Introduction
Boredom is an aversive state characterized by a difficulty to engage attention, leading to a failure to engage with our environment (Eastwood et al., 2012; Isacescu et al., 2017). Such state is triggered by a series of complex factors not well defined yet, but usually related to a failure of the environment to fulfill our need for arousal (Eastwood et al., 2012). Although some research has described boredom as a creativity and curiosity enhancer (Hunter et al., 2016; its negative effects, such as lower health-related quality of life depression, poor self-control poor job performance and others have also been widely reported.
In education settings boredom is a factor that has been related to a series of negative aspects, such as lower test results (Maroldo, 1986), dissatisfaction (Gjesme, 1977) and absenteeism (Watt, & Vodanovich, 1999). Given boredom’s impact on teaching-learning processes, here it is taken as an object of study with the goal of determining its causes in the context of a university class. In the first instance, the characteristics of boredom must be defined in order to understand it in the conceptual field and establish a frame of reference as a basis to approach the study. According to the definition of Mikulas and Vodanovich (1993), boredom is a state; such state is of low excitation and dissatisfaction and is attributed to a situation of inadequate stimulation (Mikulas, & Vodanovich, 1993). However, boredom should not be understood as a well-defined state, but as a human emotion whose definition is complex (Belton, & Priyadharshini, 2007). Such complexity makes it necessary, as with several other scales of measurement, to consider a large number of variables to be able to measure boredom levels, which is essential for its study. Scales are discussed in detail in some reviews (Vodanovich, 2003; Vodanovich, & Watt, 2016); some of them apply to academic environments, such as the Boredom Proneness Scale (Farmer, & Sundberg, 1986; Struk et al., 2017), which is a questionnaire of 28 true and false questions about the proneness of individuals to certain issues, such as concentration, entertainment or patience; the multidimensional state boredom scale (Fahlman et al., 2013), a 29 item analysis that explores disengagement, arousal, inattention and time perception; the Academic Boredom Scale (Acee et al., 2010) or the coping with boredom scale (Nett et al., 2010), which is a 10 item scale that measures when a situation needs to be changed according to the individual in order to stop feeling bored. All are constructed on the basis of emotions and use a variable number of statements that capture various aspects, such as the tendency to experience boredom in the Boredom Proneness Scale (Farmer, & Sundberg, 1986; Struk et al., 2017; Vodanovich, & Watt, 2016). However, the complexity of these scales makes their application possible only outside the activity to be evaluated. That is, they measure boredom in a global way, but it is not possible to use them to make measurements at specific moments of an activity, only of the whole activity.
Scope
In this study, we propose a measurement of boredom that can be used for the evaluation of the impact of specific events. For this, the proposed measurement must fulfill a fundamental condition: the time for the measurement must be very short so that the development of the primary activity is disturbed as little as possible. On the other hand, the proposed measurement must have a low variability to be analytically useful.
When introducing the condition of brevity, all the methodologies presented so far are discarded since their application is laborious. However, a quick measurement is not likely to take into account the variety of factors that those other methodologies include. Therefore, it is expected that their measurements present a high variability. We will address variability in the methodology.
Methodology
The students involved in this study were undergraduate students from the chemical engineering department at the University of Costa Rica. Two different groups were chosen to take the data, one group of sophomores and the other of seniors to have representation from different generations.
The data for each analysis was obtained during the development of a class using a tool in which the events (E) and the measurement of boredom (A) were taken using a self-perceived boredom scale where 1 is the lowest boring level and 10 is the highest boring level. Each measurement was made after a moment (M) which identifies the activity immediately before event E. The structure of the data collection tool is presented in Table 1.
Table 1: Structure of the data acquisition tool

Note: Prepared by the authors.
In summary, boredom is evaluated by means of a simple scale based on students’ self-perception. Boredom evaluations are carried out in various events (E) of the class chosen in such a way that the measurement allows evaluating the effect of the event on boredom.
Let A be the level of boredom according to a scale of perception from 1 to 10, where 1 is the level of least boredom and 10 that of maximum boredom. Let Ω (see Equation 1) be the rate of change of A as a function of event E for each student (S).

(Equation 1)
Let β (see Equation 2) now be the integral of the rate of change with respect to student S.
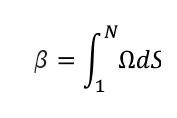
(Equation 2)
Where S is each student and N is the total number of students. In this way β is a variable that determines the net global change in the level of boredom.
Finally, the impact index  is determined. Thus determined, Ψ is an index whose value is interpreted as the average change in the units of boredom experienced since the last measurement by each student.
Results and Discussion
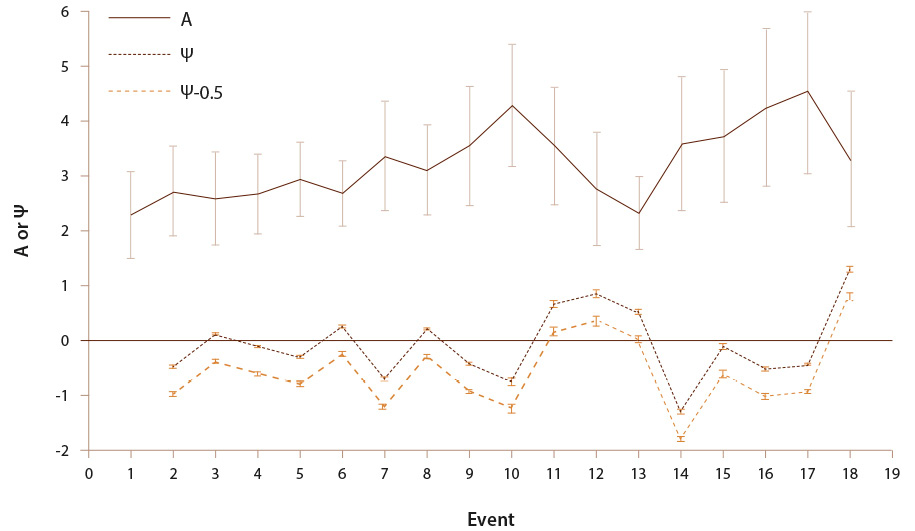
The hypothesis of this study is that the value of Ψ has low variability although the level of boredom (A) does not. In other words, it is postulated that, although the perception of boredom according to the scale used is a function of the individual, the effect on boredom of a given event is independent of who perceives it. This behavior is verified in data presented in Figure 1, which are the result of applying the proposed scale to a population of 23 students during a class divided into 18 events. Figure 1 shows how the level of boredom has inter-student variability that exceeds inter-event variation. That is, noise due to the subjectivity of perception is greater than the variation due to events. However, the variability of the impact index is much lower than its inter-event variation. In short, the group of students perceives the level of boredom with very different values of A, but there is consensus regarding the change in the level of boredom produced by an event (Ψ): most seem to become bored or discouraged in a similar way for each event.
The decrease in this variability, however, could be a homogenization effect due to inaction, that is, if the interest to carry out a proposed measurement activity is low, the level of boredom reported could be repeated in two or more measurements, causing  to be zero. In this way, variability would decrease due to inaction. To eliminate this effect, all values Ω = 0 were removed from the original data and the variability was calculated again. Data shown in gray in Figure 1 was obtained that way, presenting a slight increase in variability; however, it is not significant. To quantify such effect, we defined the next variables:
 : Standard deviation of A for the event En
 : Standard deviation of the mean value of A
 : Standard deviation of Ψ for the event En
 : Standard deviation of the mean value of Ψ
Figure 1: Level of boredom (A) and impact factor (ψ) measured in a university class. In gray, the impact factor is presented without considering the events with Ω=0 (data is displaced -0.5 units on the vertical axis to facilitate visualization)
Note: Prepared by the authors.
The relationship between the value of  and that of
  is an indicator of the relative variability of data. A relative variability that tends to zero indicates that the fluctuation between measures are negligible with respect to the measurement itself. Variability greater than one indicates that the variations in measurements are smaller than the variability of data, which renders information useless because it cannot be distinguished from noise. Therefore:

The values obtained for data of Figure 1 are:

If data where  is zero is removed, you get:

This implies that, although there is some increase in variability when eliminating the factor of increase due to inaction, the conclusion remains the same: the variability of the impact index is much less than the variation of data.
Case of study
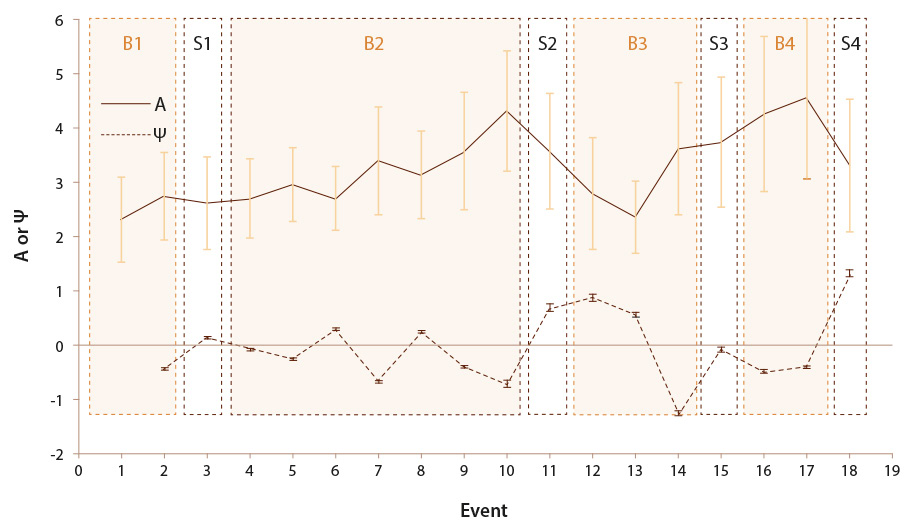
In Figure 2, Figure 1 data is presented divided into areas. Areas marked with a B represent the development of an activity (lecture, teamwork, presentations ...). Areas marked with an S are specific events construed as elements with motivational power and boredom reduction potential (presentation of practical applications, proposal of case studies, simulations ...). The impact index and the level of boredom indicated in Figure 2 correspond to the measurement made at the end of the event in which they appear. For example, at the end of event 3 in area S1, boredom was measured. This value is which occurs in area S1; therefore, S1 represents the values caused by event 3.
Areas B1 and B2 are traditional lectures, where concepts and mathematical developments are presented. The impact index for these areas, in most cases, is negative, which indicates that such events generate boredom. Some occasional positive values could be an indication of a particular interest in the subject being studied at that time. Areas marked with S have impact rates greater than zero, which confirms their positive effect in reducing boredom.
Areas B3 and S3 are of particular interest. The activity developed in B3 is a dynamic that is not supposed to lead to boredom, as it is the resolution of a problem in the class, in teams, however, although the impact index confirms this fact in events 12 and 13, event 14 drops about two points. When interviewing student teams, we discovered that they were unmotivated at event 14 because they had to present their solutions in front of the rest of the teams and failed to come up with a satisfactory solution. This event exceeded their abilities, and they perceived it as boredom.
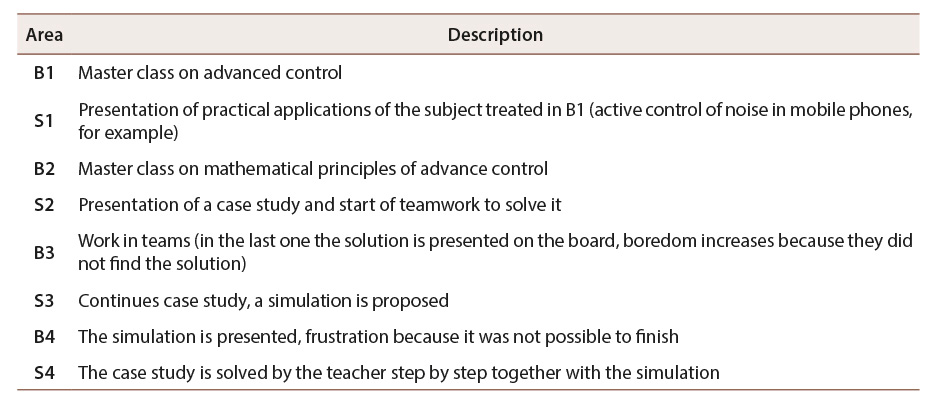
Moment S3 increases the impact index to almost zero, but since it is a continuation of the case study (the student must perform a simulation of the proposed solution), disengagement persists. The high value of area S4 is striking. It corresponds to the moment when the team presents their solution to the case study to their classmates. The details of each of the events are presented in Table 2.
Thus, it was possible to analyze the class in detail, evaluating the concrete effect of each of the activities, which renders a meticulous diagnosis, not only of the class itself but of each of its sections. This allows making corrections in the subsequent immediate class. In addition, there is a specific indication of the activities that should be improved and those that should be maintained and strengthened.
Figure 2: Level of boredom and impact index for different moments of the class grouped in areas according to a previous classification as moments where a traditional master class (B) and dynamic moments (S) are developed
Note: Prepared by the authors.
Table 2: Details of the areas of Figure 1
Note: Prepared by the authors.
Conclusions
The proposed scale allows identifying individual activities that generate boredom in the group of students. In this study, boredom was caused by monotony (areas B1 and B2 in Figure 2) and frustration (areas B3 and B4 in Figure 2) triggered when students were given a task beyond their abilities. Frustration increased perceived boredom. This is in accordance with previous studies showing boredom to be caused by a failure of the environment to fulfill our need for arousal (Eastwood et al., 2012).
The relative variability of the impact factor is about 20 times lower than the level of self-perceived boredom (A). This makes the impact factor to have analytical validity although the level of boredom does not, given its high variability.
The detailed analysis of a class, achieved with the scale presented here, is a powerful tool to improve the teaching and learning process because it gives feedback about the specific activities, then, action could be taken to change or reinforce different sections of the class design.
The tool developed here could be integrated with a facial recognition system and body language to automate measurements and implement a real-time diagnosis system.
The local boredom measurement method presented here is a promising tool when developing synchronic online classes because it could provide valuable information to improve the design of online education.
Contribution Statement
The authors declare that they have contributed in the following roles: L. G. M. contributed to the writing of the article; the management of the research process; obtaining funds, resources and technological support and the development of the research. J. A. C. C. contributed writing to the article; the management of the investigative process; obtaining funds, resources and technological support and the development of the research.
Supplementary Material
This article offers supplementary material:
-A preprint is available at https://doi.org/10.5281/zenodo.6468432
Referencias
Acee, T. W., Kim, H., Kim, H. J., Kim, J.-I., Chu, H.-N. R., Kim, M., Cho, Y., & Wicker, F. W. (2010). Academic boredom in under - and over- challenging situations. Contemporary Educational Psychology, 35(1), 17-27. https://doi.org/10.1016/j.cedpsych.2009.08.002
Belton, T., & Priyadharshini, E. (2007). Boredom and Schooling: A cross-disciplinary exploration. Cambridge Journal of Education, 37(4), 579-596. https://doi.org/10.1080/03057640701706227
Eastwood, J. D., Frischen, A., Fenske, M. J., & Smilek, D. (2012). The unengaged mind: Defining boredom in terms of attention. Perspectives on Psychological Science, 7(5), 482-495. http://www.jstor.org/stable/44280796
Fahlman, S. A., Mercer-Lynn, K. B., Flora, D. B., & Eastwood, J. D. (2013). Development and validation of the multidimensional state boredom scale. Assessment, 20(1), 68-85. https://doi.org/10.1177/1073191111421303
Farmer, R., & Sundberg, N. D. (1986). Boredom proneness--The development and correlates of a new scale. Journal of Personality Assessment, 50(1), 4-17. https://doi.org/10.1207/s15327752jpa5001_2
Gjesme, T. (1977). General satisfaction and boredom at school as a function of the pupils’ personality characteristics. Scandinavian Journal of Educational Research, 21(1), 113-146. https://doi.org/10.1080/0031383770210106
Gomez-Ramirez, J., & Costa, T. (2017). Boredom begets creativity: A solution to the exploitation–exploration trade-off in predictive coding. Biosystems, 162, 168-176. https://doi.org/10.1016/j.biosystems.2017.04.006
Hunter, J. A., Abraham, E. H., Hunter, A. G., Goldberg, L. C., & Eastwood, J. D. (2016). Personality and boredom proneness in the prediction of creativity and curiosity. Thinking Skills and Creativity, 22, 48-57. https://doi.org/10.1016/j.tsc.2016.08.002
Isacescu, J., Struk, A. A., & Danckert, J. (2017). Cognitive and affective predictors of boredom proneness. Cognition and Emotion, 31(8), 1741-1748. https://doi.org/10.1080/02699931.2016.1259995
Maroldo, G. K. (1986). Shyness, boredom, and grade point average among college students. Psychological Reports, 59(2), 395-398. https://doi.org/10.2466/pr0.1986.59.2.395
Mikulas, W. L., & Vodanovich, S. J. (1993). The essence of boredom. Psychological Record, 43(1), 3-12. https://www.researchgate.net/publication/229059999_The_essence_of_boredom
Nett, U. E., Goetz, T., & Daniels, L. M. (2010). What to do when feeling bored?: Students’ strategies for coping with boredom. Learning and Individual Differences, 20(6), 626-638. https://doi.org/10.1016/j.lindif.2010.09.004
Schwartze, M. M., Frenzel, A. C., Goetz, T., Pekrun, R., Reck, C., Marx, A. K. G., & Fiedler, D. (2021). Boredom makes me sick: Adolescents’ boredom trajectories and their health-related quality of life. International Journal of Environmental Research and Public Health, 18(12), 1-13. https://doi.org/10.3390/ijerph18126308
Struk, A. A., Carriere, J. S. A., Cheyne, J. A., & Danckert, J. (2017). A short boredom proneness scale: Development and psychometric properties. Assessment, 24(3), 346-359. https://doi.org/10.1177/1073191115609996
Vodanovich, S. J. (2003). Psychometric measures of boredom: A review of the literature. The Journal of Psychology, 137(6), 569-595. https://doi.org/10.1080/00223980309600636
Vodanovich, S. J., & Watt, J. D. (2016). Self-report measures of boredom: An updated review of the literature. The Journal of Psychology, 150(2), 196-228. https://doi.org/10.1080/00223980.2015.1074531
Watt, J. D., & Hargis, M. B. (2010). Boredom proneness: Its relationship with subjective underemployment, perceived organizational support, and job performance. Journal of Business and Psychology, 25(1), 163-174. http://www.jstor.org/stable/40605754
Watt, J. D., & Vodanovich, S. J. (1999). Boredom proneness and psychosocial development. The Journal of Psychology, 133(3), 303-314. https://doi.org/10.1080/00223989909599743

Artículo de la Revista Electrónica Educare de la Universidad Nacional, Costa Rica by Universidad Nacional is licensed under a Creative Commons Attribution-NonCommercial-NoDerivs 3.0 Costa Rica License.
Based on a work at https://www.revistas.una.ac.cr/index.php/EDUCARE
Permissions beyond the scope of this license may be available at educare@una.ac.cr
