
Revista UNICIENCIA
Uniciencia Vol. 38(1), January-December, 2024
E-ISSN: 2215-3470
DOI: https://dx.doi.org/10.15359/ru.38-1.4
Analysis of the School Climate Scale in University Environments (ECEAU)
Análisis de la Escala de Clima Escolar en Ambientes Universitarios (ECEAU)
Análise da Escala de Clima Escolar em Ambientes Universitários (ECEAU)
José Andrey Zamora-Araya1*, Karolayn Duarte-Abarca1, Darcy Quesada-Varela1, Mónica Prado-Abarca1
Received: Jun/17/2022 • Accepted: Mar/8/2023 • Published: Jan/1/2024
|
Abstract [Objective] The aim of this paper is to verify the factorial structure of the School Climate Scale in University Environments (ECEAU) through structural equation models (SEM). [Methodology] A non-experimental cross-sectional study was carried out with a random sample of 381 students of the Universidad Nacional de Costa Rica (UNA), to whom the ECEAU was applied. A SEM model was proposed to confirm the factor structure of the scale and an exploratory factor analysis (EFA) was used to provide the basis for an alternative SEM model with a different structure. The reliability of scales was determined using McDonald’s omega, and the goodness of fit indexes used for the SEM models were the RMSEA, the CFI, the TLI and the GFI. The analysis was carried out using R software. [Results] The reliability of the scales in both models was adequate (w >0.70), although the metrics in the proposed model produced better results. The AFE suggested a different structure for the ECEAU, keeping some dimensions of the original structure and modifying and eliminating others. The goodness of fit indexes in both models were almost identical, with RMSEA=0.02, CFI=0.99, TLI=0.99 and GFI=0.98, which provides supporting evidence for the factorial structures proposed. [Conclusions] The original structure of the ECEAU was confirmed, while the differences in the results of the estimation and rotation methods generated another equally valid factorial structure for measuring the school climate construct in this university, and could be applied to other similar contexts. Keywords: Factor analysis; higher education; mathematics; reliability; school climate; validity. Resumen [Objetivo] El objetivo del documento es verificar la estructura factorial de la Escala de Clima Escolar en Ambientes Universitarios (ECEAU) mediante modelos de ecuaciones estructurales (SEM). [Metodología] Se realizó un estudio transversal no experimental con una muestra aleatoria de 381 estudiantes de la Universidad Nacional de Costa Rica, a los que se le aplicó la ECEAU. Se planteó un modelo SEM para verificar la estructura factorial de la escala y un análisis factorial exploratorio (AFE) que brindó la base para proponer un modelo SEM alternativo con una estructura distinta. La confiabilidad de las escalas se determinó mediante el omega de McDonald y los criterios de bondad de ajuste para los modelos SEM fueron el RMSEA, el CFI, el TLI y el GFI. El análisis se efectuó con el software R. [Resultados] La confiabilidad de las escalas en ambos modelos resultaron adecuadas (w >0.70), aunque mejores en el modelo propuesto. El AFE sugirió una estructura diferente para la ECEAU, manteniendo algunas dimensiones de la estructura original y modificando y eliminando otras. Los indicadores de bondad de ajuste, en ambos modelos, fueron casi idénticos con RMSEA=0.02, CFI=0.99, el TLI=0.99 y GFI=0.98, lo que brinda evidencia a favor de las estructuras factoriales planteadas. [Conclusiones] Se verifica la estructura originalmente planteada en la ECEAU y las diferencias en los métodos de estimación y rotación generaron la propuesta de otra estructura factorial, igualmente válida, para medir el constructo clima escolar, en el contexto universitario estudiado y que puede ser aplicado a contextos similares. Palabras clave: análisis factorial; clima escolar; confiabilidad; educación superior; matemática; validez Resumo [Objetivo] O objetivo do artigo é verificar a estrutura fatorial da Escala de Clima Escolar em Ambientes Universitários (ECEAU) usando modelagem de equações estruturais (SEM). [Metodologia] Foi realizado um estudo transversal não experimental com uma amostra aleatória de 381 alunos da Universidade Nacional da Costa Rica, aos quais foi aplicada a ECEAU. Uma modelagem SEM foi usada para verificar a estrutura fatorial da escala e uma análise fatorial exploratória (AFE) forneceu a base para a proposta de uma modelagem SEM alternativa com uma estrutura diferente. A confiabilidade das escalas foi determinada pelo ômega de McDonald e os critérios de adequação dos modelos SEM foram RMSEA, CFI, TLI e GFI. A análise foi realizada com o software R. [Resultados] A confiabilidade das escalas em ambos os modelos foi adequada (w >0,70), embora melhor no modelo proposto. A AFE sugeriu uma estrutura diferente para a ECEAU, mantendo algumas dimensões da estrutura original e modificando e eliminando outras. Os indicadores de adequação em ambos os modelos foram quase idênticos, com RMSEA=0,02, CFI=0,99, TLI=0,99 e GFI=0,98, o que fornece evidências a favor das estruturas de fatores propostas. [Conclusões] Confirmou-se a estrutura originalmente proposta no ECEAU e as diferenças nos métodos de estimativa e rotação geraram a proposta de outra estrutura fatorial, igualmente válida, para medir o construto clima escolar no contexto universitário estudado e que pode ser aplicada a contextos semelhantes. Palavras-chave: análise fatorial; clima escolar; confiabilidade; ensino superior; matemática; validade |
Classroom climate, also known as the school or educational climate, has an influence on the teaching and learning process through different components, including the infrastructure of the classroom and institution, the teachers’ role, the methodologies and evaluations that are implemented, and student-student and student-teacher interactions. These variables are measured and analyzed based on students’ perceptions (Ríos et al., 2010; Walankar et al., 2019). In addition, students’ perceptions of school climate have been positively associated with both academic performance (Barksdale, 2021; Kutsyuruba, 2015; National School Climate Council, 2007), and processes related to institutional retention and permanence. (Buckman, et al., 2021; Lee and Burkam, 2003).
Therefore, the benefits derived from having a positive school climate and its effect on student academic performance make it possible to reduce gaps in educational achievement caused by economic and social factors, while if the school climate is unfavorable, it may disproportionately affect the most vulnerable populations (Berkowitz, 2021; O’Malley, et al., 2015).
Factors that affect academic performance are also related to affective and emotional aspects; promoting a positive school climate thus requires educational interventions or policies to create better learning environments (National School Climate Council, 2007). Research areas based on the behaviors and attitudes of the actors are therefore proposed to assist in understanding these environments (Djigic and Stojiljkovic, 2011; Juárez, 2014; Kohl, et al., 2013).
In the case of teaching and learning processes, Pereira (2010) and Kohl et al. (2013) point out that teachers’ personality characteristics, the different methods they use to deliver their classes, the type of interaction that exists between students, and the structural conditions of an institution are factors that have a direct influence on the school climate in classrooms. However, school climate is a multidimensional concept, and does not have a single definition, which make its measurement difficult (Shukla et al., 2019; Wang and Degol, 2016).
Furthermore, only a few instruments have been created to measure school climates in university environments, including the School Climate Scale in University Environments (ECEUA) created by Juárez (2014), which includes a series of factors associated with the construct, determined through a mixed study based on expert judgment and a Principal Component Analysis (PCA) with VARIMAX orthogonal rotation. However, the dimensions derived from this type of analysis are usually correlated and, from a statistical point of view, are focused on determining factors rather than reducing dimensionality.
The objective of this study is, therefore, to verify the factor structure of the ECEUA, firstly through an exploratory factor analysis (EFA) with a more appropriate oblique rotation for correlated factors and a more robust estimation method than the one originally used in the creation of the ECEUA, since the original author of the instrument used a principal component analysis (PCA) instead of EFA, to be able to assess if there are changes in its structure. To do so, it is proposed to analyze it together with the original structure using Structural Equation Modeling (SEM) to obtain empirical evidence for the validity of the scale for measuring the educational climate construct.
The concept of classroom climate has been of great interest in the area of education; however, there are relatively few instruments designed for measuring this construct, and it has also been studied using interviews, focus groups, observations and classroom reports (Lenz et al., 2020).
Among the scales that have been used for measuring school climate, particularly at the primary and secondary educational levels, is the Delaware School Climate Survey-Student (DSCS-S) scale, which measures perceptions of relationships among members of the educational community, for example: teacher-student relationships, teacher-tutor relationships, student-student relationships, school safety, equity and clarity of the rules, and behavioral expectations. This scale has several versions, depending on whether the target population is teachers, parents or students (Bear et al., 2014).
Another instrument used in educational settings is the Inventory of School Climate-Stundt (ISC-S), which was designed to assess dimensions of the school environment which are consistently related to students’ adjustment to institutions, such as support behavior, consistency and clarity of rules and expectations, student engagement and achievement orientation, peer-to-peer interaction, disciplinary strictness, student input in decision-making, educational innovation, relevance, support for cultural pluralism, and safety concerns (Brand et al., 2003). Similarly, the School Climate Measure (SCM), based on a robust psychometric analysis, uses eight dimensions for studying school climate, similar to those of ISC-S, namely: (1) positive student-teacher relationships, (2 ) school connection, (3) academic support, (4) order and discipline, (5) physical environment, (6) social environment, (7) perception of exclusion/privileges and (8) academic satisfaction (Zullig et al., 2010).
Other scales have been created for other specific contexts, such as the Japan School Climate Inventory (JaSC), which is oriented towards the Japanese educational context, and was created based on the structures of instruments applied in the western world (Nishimura et al. al., 2020). In the Spanish-speaking world, one of the scales developed to measure the construct is the School Social Climate Scale (ECLIS), a Chilean instrument that evaluates the school climate through five subscales: (1) “My Teachers,” (2 ) “My classmates,” (3) “Places,” (perception of infrastructure), (4) “My school” (global evaluation of the institution), and (5) “Bullying” (harassment) (Aron et al., 2012).
As mentioned previously, instruments to be used in higher education are scarce, since most studies have focused on the primary and secondary levels (Buckman et al., 2021; Nishimura et al., 2020; Sudla et al., 2020) or on specific academic programs, many of them in the area of health sciences (Al-Natour, 2019; Kaur et al., 2021; Krupat et al., 2017). One of the few instruments in Spanish aimed at a general university population is the ECEUA, created by Juárez (2014), which has a theoretical basis for its construction and was validated in a group of 693 university students of the Universidad Tecnológica de León, located in the city of León Guanajuato, México. The ECEUA has been used in research that considers educational climate as a construct that can help explain student academic performance at the university level (García et al., 2022; Loza et al., 2020).
Garcia et al. (2022) recently created a school climate scale for higher education environments which was applied to 329 Mexican students, from first enrollment to the licentiate level of public and private universities, which uses other scales as a base, including Juárez (2014), called the school climate scale for university students (ECE-U). The ECE-U is made up of six subscales: (1) Teacher support, (2) University belonging, (3) Relationship with peers, (4) Aggressiveness in the school, (5) University regulations, and (6) Institutional resources. In general terms, the instruments used for measuring the school climate consider social, individual, academic and interaction aspects to establish their dimensions.
Therefore, to create an instrument that makes it possible to measure school climate in a university, and based on the similarities of the Mexican and Costa Rican university systems, it was decided to use the ECEUA in a population of students who had enrolled in mathematics courses at the Universidad Nacional de Costa Rica (UNA), where academic performance has historically been low and whose dropout rate is high. Only about 50% of the students entering the UNA each year meet graduation requirements, resulting in decreases in graduation efficiency in higher education and in the number of professionals that the university provides for the labor market (Rodríguez and Zamora, 2021).
The application of the ECEUA to the university context is intended to verify the factorial structure of the scale through its implementation in a similar context, focused in this case on students who receive mathematics courses, to assess its possible application in other university environments, and thereby contribute to improving the quality of the teaching and learning process.
This section is divided into two sections. The first consists of a brief review of the conceptualization of school climate and its importance in the field of academics. The second explains the formulation of the ECEAU, the process of its construction, and its factorial structure.
School climate as a theoretical construct
This work is based on the concept of school climate of Sudla et al. (2020), who view it as a multidimensional construct which describes the quality and characteristics of an educational institution. It is also an experience shared by the different persons who are part of an institution, which can affect their thoughts, feelings and behavior. Given its multifactorial nature, the concept of school climate has multiple definitions. In this paper the definition proposed by Juárez (2014) is the one used: “School climate is the set of structural, functional and interactional characteristics that frame the development of the usual activities of members of the institution, reflected in the perception of satisfaction that it generates for them.” (p. 65).
In this regard, the school climate is considered as an aspect framed within the prevailing culture in educational institutions, which can be observed through the interactions, results and behaviors that occur every day within an educational center; that is, the culture of the institution creates the school climate, which is perceived by a group and which is directly related to the way people feel about their experiences in that institution (Cohen et al., 2009; Roby, 2011).
Furthermore, according to Smith et al. (2014) school climate is determined by the perceived beliefs that the persons involved have regarding their educational center, influenced by the norms, goals, values, interactions with the members of the educational community, teaching methodologies and organizational structures of the institution. A positive school environment can help improve the quality of education, and its measurement allows the detection of problems of coexistence that can be affected by institutional actions to improve them, thus contributing to a pleasant and beneficial coexistence for all its members (Sudla et al., 2020).
On the other hand, as mentioned previously, there is a lack of consensus regarding the definition of the concept of school environment and parameters for its measurement, which has led to the use of the concept to refer to varying aspects associated with school environments, emphasizing its multidimensional nature, while different authors emphasize different aspects of the construct, depending on their research interests (Kaur et al., 2021; Nishimura et al., 2020; Shukla et al., 2019). For example, Wang and Degol (2016), based on a theoretical review of 327 documents, suggest that the school climate encompasses four main dimensions: (1) safety: subcategorized into emotional/social, physical, discipline and order; (2) community: subdivided into camaraderie, quality of relationships, connectivity, and respect for diversity; (3) academic: whose sub-dimensions are leadership, professional development, teaching and learning, and (4) institutional environment, which includes environment, organizational structure and availability of resources; thus verifying the multidimensionality of the construct.
Kutsyuruba, Klinger, and Hussain (2015) also analyzed the multidimensionality of the school climate and proposed three major areas: (1) social, (2) academic, and (3) physical. As can be seen, the concept of school climate is often adapted to the context and needs of the research team, showing that the phrase has no single meaning. But there does seem to be agreement regarding its effect on the teaching and learning process, on students’ development, and on the perception or positive opinion that those involved have about the subject. All these indicators can provide an approximation to the classroom climate (Juárez, 2014).
Another way to categorize the classroom climate is by identifying it as positive or negative for students. According to this approach, a positive classroom climate generates an environment in which students feel safe, accompanied, and appreciated, and the teacher has the initiative to maintain assertive communication with the students to promote their positive personal development; on the other hand, certain characteristics of the students, including stress, depression, and lack of interest, indicate a negative classroom climate, which may happen when there is poor teacher-student communication (Aron and Milicic, 1995; Kutsyuruba et al., 2015; Loza et al., 2020).
Similarly, Ríos et al. (2010) state that perception of situations within the classroom is based on a positive or negative climate. In the first case, teacher-student communication is based on respect, while the teacher’s action encourages the participation of his or her students and pleasantly answers the questions that arise; to the contrary, a negative climate will cause the opposite effects.
In a related article, Galván (2015) points out that since the teacher-student relationship is more distant in tertiary education than it is in primary and secondary education, university students show a positive reaction when the teacher shows interest in having a close relationship, in which the teacher is willing to listen to them, and shows interest in the topics that are important to them. The same happens when the teacher provides students with study support materials, or clear explanations of instructions in examinations, which results in a positive teacher-student relationship.
Theoretical support for use of the School Climate Scale in University Environments
For the construction of the ECEAU, Juárez (2014) carried out a mixed study. In its first stage, he listed 351 items that were reduced to 76 items by expert judgement, which were applied to a sample of 170 students in a pilot stage, in which a principal component analysis (PCA) was performed with VARIMAX rotation and maximum likelihood estimation, reducing the scale to 41 items. At a later stage, he applied this latest version to a final sample of 693 students for final validation, which resulted in the generation of three principal dimensions: institutional, educational interactions and satisfaction, which are defined as follows:
Institutional dimension: Considers organizational and functional aspects of the school or educational institution, including the image of the institution, and regulatory frameworks.
Educational interactions dimension: Refers to practices, procedures, relationships, attitudes and behaviors among the persons in the institution, and their relationship with the environment.
Satisfaction dimension: Opinions and perceptions of the persons who pertain to the educational institution are evaluated according to the level of satisfaction of the classroom climate that they have experienced.
Based on these dimensions, Juárez (2014) established a classification of factors and indicators intended to evaluate the classroom climate, which are:
Factor 1: Organizational structure; this aspect frames what students perceive about the organizational signs and standards designed in the educational institution which are related to the classroom climate.
Factor 2: Functionality; which reflects what students think about the communication channels that guide them in their training process.
Factor 3: Teacher-student interaction; this refers to how the teacher and student relate to each other, based on aspects such as dialogue, the teacher’s demonstration of interest in the students in the learning process, conflict resolution, and how much congruence exists between what the teacher says and how he or she acts.
Factor 4: Teaching practices; in which the teaching-learning methodology is associated with the students’ opinions about methodological practices implemented by the teacher to meet the academic objectives established for the learning process. Indicator 1 considers evaluation practices from the students’ perspective, analyzing the evaluation criteria of a certain subject, and whether or not the teacher provides feedback to support his or her teaching practices.
Factor 5: Peer-to-peer interaction; this refers to the relationships between students in certain situations within work groups, for example, in conflict resolution, the moments where students can express ideas. Indicator 2 considers external interactions, evaluating the support that the University provides to students to locate themselves within the community and in the business sector.
Factor 6: Satisfaction; this is a criterion to obtain information on students’ opinions about the satisfaction they feel with respect to their stay at the university.
As can be seen, Juárez (2014) developed the dimensions, factors and indicators and, to better understand the theoretical proposal, the research team (for this investigation) synthesized the organization of the dimensions with respect to the factors and indicators of the ECEAU scale using a graphic representation in which the interrelationships of these concepts can be more clearly observed. The educational climate is considered as the main construct, the dimensions as second level constructs, and the factors and indicators as third and fourth level constructs, according to the theoretical analysis and construction procedure of the scale. Figure 1 shows the arrangement of each factor or indicator according to the dimension in which it was classified, representing the factorial structure to be confirmed by means of a SEM analysis.
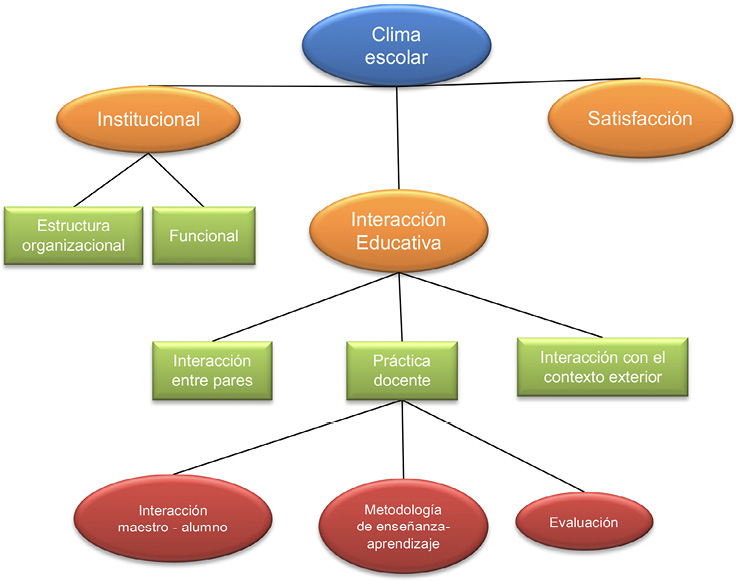
Figure 1. Classification of the dimensions, factors and indicators used in the ECEAU.
Source: Prepared by the authors.
The scale created using these factors and indicators can be used to evaluate the university school climate, providing an approximation of the climate in which the learning process takes place, and how it serves as support for the teacher in planning and structuring his or her future actions to carry out the training of their students. Given that the ECEAU is one of the few instruments developed for measuring school climate in university contexts, and that its construction, initial application and validation processes were carried out in a context similar to that of the Universidad Nacional, it was decided to use this scale for analyzing classroom climate in Costa Rican higher education.
In this research the methodology is based on a cross-sectional correlational non-experimental quantitative design. The study population was the student body enrolled in the service courses delivered by the School of Mathematics of the Universidad Nacional de Costa Rica during the II Cycle of 2019; courses were offered by the School of Mathematics for careers in the areas of engineering, social sciences and, in general, careers that require subjects such as Calculus, General Mathematics, Linear Algebra, Advanced Calculus, Probability and Statistics, among others. In total, 66 groups of these courses were available, with a total of 2,310 enrolled students.
The sample was selected using systematic random sampling from a list in which all service courses taught were included. The sample consisted of 20 groups, 14 of which belonged to the first levels of the careers, for a total effective sample of 381 surveyed students, 247 men and 134 women, with ages ranging from 17 to 49 years.
The coordinator of the mathematics service courses, the teachers selected in the sample, and the students enrolled in the courses were consulted about the application of the instrument. An informed consent form was provided for those persons who agreed to collaborate in the investigation, which included provisions for safeguarding and maintaining anonymity of the information provided. For data collection, the scale developed by Juárez (2014) was used, which consists of 41 questions with a scale of 1 to 4, where 1 indicates strongly disagree, 2 disagree, 3 agree, and 4 strongly agree.
The instrument was adapted to be applied to the context of the UNA; these instruments, the code to replicate the results and the database can be found at the following link: https://github.com/andreyzamora/Clima-Educativo.
As a first step, an exploratory factor analysis (EFA) was applied to the ECEAU to verify if its results were in agreement with the factorial structure of the scale, given that a different estimation and rotation method was applied to the construction process of the ECEAU. Based on the results of this analysis, a proposal arose to modify the original structure of the scale. Structural equation modeling (SEM) was applied to both the original structure and the new proposed structure to compare them, using the root mean square error of approximation (RMSEA), the comparative fit index (CFI), the Tucker-Lewis index (TLI) and the goodness of fit index (GFI) as measures of goodness of fit.
According to Juárez (2014), the items of the ECEAU scale were selected through a rigorous process that involved expert judgement, and its final structure was a combination of this judgment and a principal component analysis (PCA) as a means to carry out the exploratory analysis, using VARIMAX rotation and the maximum likelihood estimation method. However, Lloret-Segura (2014) stated that it was not appropriate to use PCA for verifying the factorial structure of an instrument whose objective is to determine its factorial structure, and he did not recommend using orthogonal rotations, such as VARIMAX when working with constructs in the field of the social sciences, since they are usually correlated.
To the contrary, it is recommended to use factor analysis and minimum residual (MinRes) or unweighted least squares estimation instead of a maximum likelihood estimation, since it tends to produce better results for this type of instrument. Therefore, the EFA method was used to analyze the ECEAU scale, but using oblique rotation because, based on the underlying theory, the dimensions of the educational climate construct are related to each other. In addition, the MinRes method was used to determine how much the originally proposed factorial structure varied. This is a highly recommended approach which has been shown to be effective in minimizing the sum of the squares of the differences between the observed and the reproduced correlation matrices (Izquierdo et al., 2014).
Given that the objective of this study is to identify the number and composition of the common factors associated with a latent trait and thus explain the common variance based on the items that make up the ECEAU, it is appropriate to use EFA rather than a principal component analysis (PCA), since the latter is used for identifying the number and composition of the components necessary to summarize observed scores in a large set of observed variables; that is, it is a dimensionality reduction technique. The objective of using EFA is to evaluate the factorial structure of the instrument, and contrast this structure with the ECEAU by means of SEM analyses (see Figures 1 and 2). The lavaan and psych libraries of the statistical software R version 4.0.2 were used in the analysis of results.
One of the measures of adequacy of a sample for a factorial analysis is the Kaiser-Meyer-Olkin (KMO) statistic, together with the Barttlet sphericity test, which yielded values of 0.93 (p < 0.001) and chi-square of 1950.02, df= 820 (p< 0.001). It was therefore concluded that it was appropriate to carry out an EFA with these data.
The polychoric correlation matrix was used because the items were ordinal in nature, which according to Lloret-Segura et al. (2014) generally requires a larger sample size than when the Pearson’s product-moment matrix is used, and high values of item commonalities; however, there was a sufficient sample size of 381 cases and the value of the commonalities was moderately high with most of the scores being between 0.33 and 0.70. The estimation method used was the minimum residuals (MinRes) equivalent to unweighted least squares which, unlike those based on maximum likelihood, are more computationally efficient and more appropriate when working with polychoric correlation matrices (Lloret-Segura et al., 2014; Pere-Joan and Anguiano-Carrasco, 2010).
When determining the number of factors, several criteria were considered, among them parallel analysis obtained through the fa.parallel function of the R psych package, which suggested six factors, calculation of the Minimum Average Partial Test (MAP), which suggested seven factors for minimizing the correlation between the residuals, and the theory underlying the instrument given by Juárez (2014), which indicated six factors. Because of the interpretability and consistency of the previous indicators, it was decided to work with six factors.
Table 1 shows the results of the EFA for the ECEAU. The names of the items reflect the classification of dimensions made by Juárez (2014), as shown in Figure 1. The EFA suggested the presence of six factors, but there was no perfect coincidence with those factors proposed by Juárez (2014). This is explained by the fact that a different method of rotation and estimation of factors was used.
Results of the EFA for the ECEAU applied to students enrolled in Mathematics courses, Universidad Nacional, Costa Rica II cycle 2019. N =381
|
Item |
Teacher-student communication |
Peer-to-peer interaction |
Pedagogical mediation |
Organizational structure |
Institutional communication |
External context |
|
Organizational 1 |
-0.01 |
0.04 |
0.14 |
0.63 |
-0.07 |
-0.04 |
|
Organizational 2 |
0.05 |
0.03 |
0.07 |
0.43 |
0.04 |
-0.02 |
|
Organizational 3 |
-0.19 |
0.05 |
0.30 |
0.35 |
0.16 |
-0.08 |
|
Organizational 4 |
-0.18 |
0.12 |
0.24 |
0.42 |
0.16 |
-0.12 |
|
Organizational 5 |
-0.10 |
0.00 |
0.31 |
0.10 |
0.50 |
0.04 |
|
Functional 6 |
0.01 |
-0.07 |
0.02 |
-0.01 |
0.65 |
0.11 |
|
Functional 7 |
0.01 |
-0.05 |
-0.02 |
0.10 |
0.69 |
0.00 |
|
Functional 8 |
0.03 |
0.04 |
-0.04 |
-0.14 |
0.60 |
0.03 |
|
Functional 9 |
0.01 |
0.05 |
0.02 |
0.04 |
0.49 |
-0.01 |
|
Functional 10 |
0.02 |
0.12 |
-0.03 |
0.06 |
0.62 |
-0.07 |
|
1TSI 11 |
0.13 |
0.04 |
0.33 |
0.02 |
0.06 |
0.08 |
|
TSI 12 |
0.23 |
0.03 |
0.55 |
0.07 |
0.00 |
0.00 |
|
TSI 13 |
0.09 |
0.01 |
0.77 |
0.03 |
0.00 |
0.05 |
|
TSI 14 |
0.05 |
0.04 |
0.79 |
0.01 |
0.05 |
0.01 |
|
TSI 15 |
0.14 |
0.03 |
0.68 |
-0.04 |
0.06 |
0.07 |
|
TSI 16 |
0.33 |
0.01 |
0.38 |
0.00 |
0.07 |
0.07 |
|
TSI 17 |
0.74 |
0.00 |
0.01 |
0.10 |
0.01 |
-0.13 |
|
TSI 18 |
0.44 |
-0.03 |
0.39 |
0.01 |
-0.01 |
0.09 |
|
TSI 19 |
0.62 |
-0.12 |
0.19 |
0.08 |
0.00 |
0.01 |
|
Methodology 20 |
0.67 |
-0.03 |
0.16 |
0.05 |
-0.01 |
0.03 |
|
Methodology 21 |
0.70 |
0.15 |
-0.04 |
-0.07 |
0.12 |
-0.01 |
|
Methodology 22 |
0.65 |
0.09 |
-0.01 |
0.05 |
-0.04 |
0.02 |
|
Methodology 23 |
0.69 |
0.07 |
-0.02 |
0.07 |
-0.01 |
-0.02 |
|
Methodology 24 |
0.69 |
0.05 |
0.07 |
0.00 |
0.01 |
0.03 |
|
Evaluation 25 |
0.52 |
0.04 |
0.22 |
-0.03 |
0.03 |
0.01 |
|
Evaluation 26 |
0.44 |
0.03 |
0.32 |
-0.06 |
-0.02 |
0.07 |
|
Evaluation 27 |
0.30 |
0.15 |
0.33 |
-0.07 |
0.00 |
0.11 |
|
2PPI 28 |
-0.1 |
0.78 |
0.09 |
0.05 |
-0.04 |
-0.03 |
|
PPI 29 |
0.02 |
0.78 |
0.05 |
0.02 |
0.04 |
-0.07 |
|
PPI 30 |
0.02 |
0.74 |
0.05 |
0.05 |
-0.06 |
0.04 |
|
PPI 31 |
0.12 |
0.52 |
-0.04 |
-0.09 |
0.05 |
0.20 |
|
PPI 32 |
0.1 |
0.74 |
-0.16 |
-0.01 |
0.04 |
0.02 |
|
PPI 33 |
0.04 |
0.64 |
0.01 |
-0.03 |
0.04 |
0.11 |
|
3EC 34 |
-0.02 |
0.09 |
0.08 |
0.06 |
0.17 |
0.55 |
|
EC 35 |
-0.09 |
0.05 |
0.06 |
0.08 |
0.00 |
0.72 |
|
EC 36 |
0.00 |
0.01 |
0.02 |
0.07 |
0.02 |
0.79 |
|
Satisfaction 37 |
0.06 |
0.01 |
-0.08 |
0.63 |
0.01 |
0.25 |
|
Satisfaction 38 |
0.10 |
0.01 |
-0.11 |
0.59 |
0.16 |
0.18 |
|
Satisfaction 39 |
0.09 |
-0.01 |
-0.08 |
0.66 |
0.05 |
0.21 |
|
Satisfaction 40 |
0.01 |
0.16 |
0.07 |
0.48 |
0.09 |
-0.02 |
|
Satisfaction 41 |
0.11 |
0.09 |
0.03 |
0.58 |
0.08 |
-0.06 |
1TSI: Teacher-student interaction
2PPI Peer-to-peer interaction
3EC External context
Note: Source prepared by the authors.
Regarding the criteria for assigning items to the factors, it was decided to maintain those whose saturations were greater than 0.30. In addition, goodness of fit indicators show a strong fit of the model to the data: the root mean square of the residuals RMSR = 0.03 is close to zero; the root mean square index of the approximation error RMSEA =0.025; and the Tucker-Lewis reliability index TLI = 0.993. Table 2 shows the proportion of variance explained for each of the six factors considered in the analysis, resulting in a similar contribution of each of them to the common variance.
Indicators related to the variance of the ECEAU factors
|
Indicator |
Teacher-student communication |
Peer-to-peer interaction |
Pedagogical mediation |
Organizational structure |
Institutional communication |
External context |
|
Self-values |
5.26 |
3.53 |
4.01 |
3.31 |
2.72 |
2.13 |
|
Proportion of variance |
0.13 |
0.09 |
0.10 |
0.08 |
0.07 |
0.05 |
|
Proportion of accumulated variance |
0.13 |
0.21 |
0.31 |
0.39 |
0.46 |
0.51 |
|
Proportion of variance explained for each factor |
0.25 |
0.17 |
0.19 |
0.16 |
0.13 |
0.10 |
|
Proportion of accumulated variance explained for each factor |
0.25 |
0.42 |
0.61 |
0.77 |
0.90 |
1.00 |
Note: Source prepared by the authors.
In addition, Figure 2 shows the correlation of each of the six factors and the items that make up each factor; that is, it is the representation of the SEM model proposed based on the EFA. These correlations range between 0.46 and 0.94, which shows that the factors are associated as established by the underlying theory and that it is therefore appropriate to apply an oblique rotation. Likewise, the goodness of fit statistics for the proposed model, using a non-orthogonal rotation, through the MinRes estimation, were satisfactory (see Table 3).
Goodness of fit indicators for the proposed and original SEM models of the ECEAU
|
Model |
RMSEA |
CFI |
TLI |
GFI |
|
Original |
0.024 |
0.994 |
0.994 |
0.979 |
|
Proposed |
0.025 |
0.993 |
0.993 |
0.979 |
Note: Source prepared by the authors.
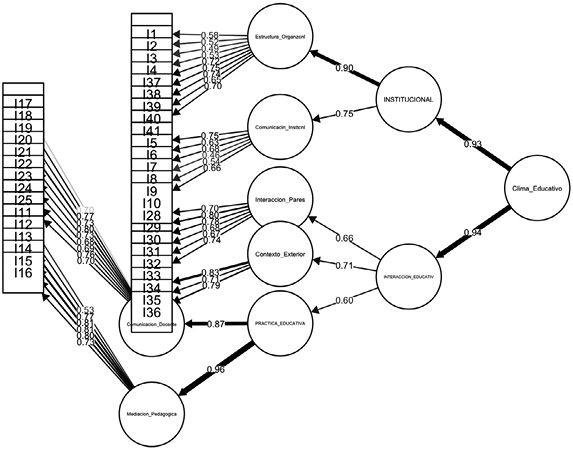
Figure 2. Confirmatory factor analysis for the proposed constructs of the ECEAU.
Source: Prepared by the authors.
A SEM model was also applied in a similar fashion to the structure originally proposed by Juárez (2014) for the ECEAU, with non-orthogonal rotation and the same estimation method used for the proposed model, which produced acceptable goodness of fit indicators of adjustment (see Figure 3), thus providing evidence for the initially established factorial structure.
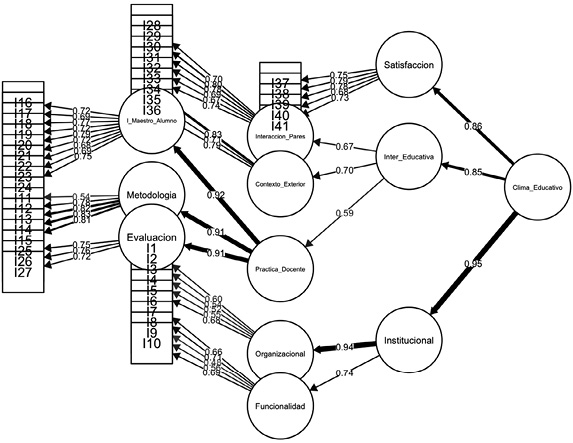
Figure 3. Confirmatory factor analysis for the constructs originally proposed for the ECEAU
Source: Prepared by the authors.
The goodness of fit statistics of both models are almost the same, although their factorial structure is slightly different, as shown in the items that make up the respective scales that operationalize the constructs. However, the factorial structure for the ECEAU of the proposed SEM model takes into account the theoretical basis with which the scale was built, but reassigns some items between the scales and maintains others.
The McDonald’s Omega test was used as a reliability measure for the scales, as recommended for ordinal data used in the modeling of Cronbach structural equations (Green and Yang, 2009). Cronbach’s alpha measurement is also specified for comparative purposes, as shown in Table 4.
Internal consistency analysis of the items in the EFA applied to the ECEAU for
students enrolled in mathematics courses at the Universidad Nacional,
Costa Rica II cycle 2019. N =381
|
Proposed model |
Original model |
||||||
|
Construct |
Number of items |
Omega |
Alpha |
Construct |
Number of items |
Omega |
Alpha |
|
Teacher communication |
10 |
0.934 |
0.918 |
Teacher-student interaction |
9 |
0.928 |
0.906 |
|
Peer-to-peer interaction |
6 |
0.904 |
0.866 |
Peer-to-peer interaction |
6 |
0.904 |
0.866 |
|
Pedagogical mediation |
7 |
0.944 |
0.876 |
Teaching-learning methodology |
5 |
0.899 |
0.865 |
|
Organizational structure |
9 |
0.887 |
0.854 |
Organizational structure |
5 |
0.764 |
0.713 |
|
Institutional communication |
6 |
0,848 |
0,788 |
Functionality |
5 |
0.792 |
0.756 |
|
External context |
3 |
0,836 |
0,822 |
External context |
3 |
0.836 |
0.822 |
|
- |
- |
Evaluation |
3 |
0.794 |
0.785 |
||
|
- |
- |
Satisfaction |
5 |
0.899 |
0.858 |
||
Note: Source prepared by the authors.
As can be seen in Table 4, the reliability of the scales of both models is acceptable (greater than 0.70); however, the proposed model shows better indicators in all scales, compared to those obtained using the original model, whose indicators are slightly higher than those presented in the study by Juárez (2014). This does not imply that one model is better than the other, only that both show an adequate internal consistency of their respective scales. In addition, both analyses maintain the dimension of educational interaction, as well as the factors of organizational structure, interaction with the external context, peer-to-peer interaction, and teacher-student interaction, although not with the same items in all cases.
In contrast, the present analysis eliminates the dimension of satisfaction proposed by Juárez (2014), whose items are absorbed by the category of organizational structure. This is due to the fact that the EFA used in this study, based on an oblique rotation (which is more appropriate for working with data from social contexts than orthogonal rotations) did not encounter a difference between the items of the satisfaction factors and organizational structure, as shown by the factor loadings in Table 1.
Furthermore, the functionality factor is replaced by a new construct called institutional communication that incorporates Item 5 of the educational climate instrument “we (the students) know to whom we can communicate our concerns regarding teachers’ performance.” This change is explained by the fact that the items correspond more closely to aspects of communication between the student body and the university. Accordingly, for the purposes of this investigation, the institutional communication factor is understood as communication between the different levels of the university with the student community in pursuit of the students’ well-being, and to evaluate their opinions.
On the other hand, the factors of teacher-student interaction, evaluation practices and teaching and learning methodologies are replaced by those of teacher-student communication and pedagogical mediation. The EFA reorganizes the 17 items of Juárez’s approach (2014) into these two new factors related to educational practice in the classroom.
Teacher-student communication will be understood as the communication (either verbal or non-verbal) that the teacher has with his or her students, considering the interest shown by the teacher in achieving the students’ well-being and learning development. Likewise, pedagogical mediation will be understood as the actions of a teacher to promote and favor education of his or her students in a particular educational area, based on the students’ opinions.
These concepts were defined based on the experience of the research team and the consideration of the factor loadings of the scale items, which is essential for understanding the factors resulting from the EFA, and contributes to conceptualizing the results of items being incorporated into groups other than those of the ECEAU. Table 5 presents a comparison between the dimensions and factors of both models, facilitating consideration of the similarities and differences between them.
Finally, Figure 4 summarizes the proposal of this investigation for the dimensions and factors of the educational climate construct based on the SEM model based on the EFA developed in this research, as opposed to the model originally proposed by Juárez (2014) presented in Figure 1.
Comparison of factor analyses of the original Juárez (2014) proposal for the ECEAU and that applied to students enrolled in mathematics courses at the Universidad Nacional, Costa Rica II cycle 2019. N =381
|
Juárez proposal (2014) |
Proposal developed in this investigation |
||||||||
|
Dimension |
Factors and indicators |
Amount of items |
Numbers of items |
Dimension |
Factors |
Amount of items |
Numbers of items |
||
|
Institutional |
Organizational structure |
5 |
1,2,3,4,5 |
Institutional |
Organizational structure |
9 |
1,2,3,4,37, 38,39,40,41 |
||
|
Functionality |
5 |
6,7,8,9,10 |
Institutional communication |
6 |
5,6,7,8, 9,10 |
||||
|
Satisfaction |
Satisfaction |
5 |
37,38,39,40, 41 |
||||||
|
Educational interactions |
Interaction with external context |
3 |
34,35,36 |
Educational interaction |
Interaction with external context |
3 |
34,35,36 |
||
|
Peer-to-peer interaction |
6 |
28,29,30,31, 32,33 |
Peer-to-peer interaction |
6 |
28,29,30,31, 32,33 |
||||
|
Teaching practices |
Teacher-student interaction |
9 |
11,12,13,14, 15,16,17,18, 19 |
Teaching practices |
Teacher-student communication |
10 |
17,18,19,20, 21,22,23,24, 25,26 |
||
|
Evaluation practices |
3 |
25,26,27 |
Pedagogical mediation |
7 |
11,12,13,14, 15,16,27 |
||||
|
Teaching-learning methodology |
5 |
20,21,22,23, 24 |
|||||||
Note: Source prepared by the authors.

Figure 4. Exploratory factor analysis of the Proposal for classification of dimensions and factors derived from the EFA with students enrolled in mathematics courses, Universidad Nacional, Costa Rica II cycle 2019. N =381.
Source: Prepared by the authors.
The construct of educational climate is relevant for understanding the interactions between different actors in the educational process. The ECEAU is an instrument created for measuring and obtaining empirical evidence about this construct in university environments. Although the ECEAU was created through a rigorous process involving qualitative and quantitative analyses, an explicitly theoretical model bringing together the results of the process of constructing the scale has not been developed. Such a theoretical model is presented here, based on research by Juárez (2014), whose factorial structure is validated using a SEM model, based on the analysis of a sample of university students of the Universidad Nacional de Costa Rica who have enrolled in courses in the area of mathematics, and whose goodness of fit indicators validate the structure proposed for measuring school climate in a university context.
Notwithstanding the valuable contributions of the ECEAU, it was also interesting to verify if applying the scale in the context of students whose careers require mathematics courses, using an EFA approach instead of PCA, with recommended methods and rotations for constructs measured based on categorical variables, would change the factorial structure of the scale.
In fact, when the instrument was replicated in this educational context using oblique rotation and estimation of unweighted least squares, the structure changed. It was therefore decided to propose an alternative factorial structure using EFA instead of PCA, which produced results for the composition of the dimensions and factors which were different from those of the original scale.
This discrepancy is possibly due to the fact that Juárez (2014) based his approach on the use of a PCA based on a Pearson product-momentum matrix, with a VARIMAX orthogonal rotation instead of an EFA with oblique rotation. It is important to mention that current recommendations, when applying an EFA to theoretical constructs in the social field, such as psychology or education, discourage the application of the technique used by Juárez (2014) (Ferrando and Lorenzo-Seva, 2014; Ledesma et al., 2019; Lloret-Segura et al., 2014). In addition, the application to students who enrolled in courses in the area of mathematics may also have affected the structure.
When considering the differences found when comparing analytical techniques, the following aspects were considered: first, the ECEAU items are expressed on an ordinal scale, in which case current recommendations suggest using a polychoric correlation matrix, because the product-moment matrix is used when the items have a numerical scale or their ordinal scale has five or more options, but the ECEAU items only have four options (Izquierdo et al., 2014).
Second, given that the factors underlying the instrument are theoretically correlated, an orthogonal rotation that assumes no correlation, such as VARIMAX, is not appropriate and, therefore, oblique rotations such as PROMAX or OBLIMIN are preferred (Ledesma et al., 2019; Pere-Joan and Anguiano-Carrasco, 2010).
Third, there are currently more efficient factor estimation methods than PCA, which strongly depends on the quality of initial estimations of commonalities, such as the MinRes method, which is equivalent to the unweighted least squares method, one of the most recommended methods when working with categorical variables (Izquierdo et al., 2014; Lloret-Segura et al., 2014).
Fourth, the EFA used in this investigation to determine the number of factors to consider takes into account both objective criteria such as the minimum average partial (MAP) test or parallel analysis, as well as the theoretical foundation and the ability to interpret results. Finally, the results of this study show the importance of taking into account current recommendations for applying EFA and how interpretations of the nature of a construct, such as educational climate, may vary when considering different criteria for choosing the estimation method, the type of correlation matrix and the model’s rotation.
Despite these differences when applying SEM models, both on the original structure and the structure proposed in this research, goodness of fit statistics were practically the same, demonstrating the structural validity of both models. However, the restructuring suggested in the proposed model yielded better reliability indicators than those of the original model, and offers an alternative structure for the ECEAU items.
It is expected that future research can replicate one or both of these models and confirm or reject the structures proposed in this study, or propose others. This would help to evaluate both theoretical approaches, and collect empirical evidence in favor of one or the other proposal. Other investigations may focus on specific areas of knowledge typical of the dynamics of higher education institutions such as basic sciences, social sciences or the arts, and contrast the results with the proposals presented here. However, the data indicate that both approaches are worthy of merit, without suggesting that either proposal is better or worse than its counterpart, but more studies using the ECEAU in other university contexts are required to support or refute the results obtained here.
Finally, interested persons are also urged to use the ECEAU as a measurement instrument for educational climate, thus enabling the implementation of actions aimed at improving classroom climate, which will have impacts not only on academic performance, but also on the affective component, which is so important in the teaching and learning processes.
National University, Costa Rica.
The authors declare that they have no conflict of interest.
Authors’ contribution statement
All the authors declare that the final version of this article was read and approved.
The total percentage of contribution for the conceptualization, preparation and correction of this article was the following: J.A.Z.A. 40%, K.D.A. 20%, D.Q.V. 20% and M.P.A. 20 %.
The data that support the results of this study, including the instrument and computer codes used, are only available for consultation through the link [https://github.com/andreyzamora/Clima-Educativo].
Al-Natour, S. H. (2019). Medical Students’ Perceptions of their Educational Environment at a Saudi University. Saudi Journal of Medicine & Medical Sciences, 7(3), 163-168. http://doi.org/10.4103/sjmms.sjmms_141_17
Aron, A. M., Milicic, N. y Armijo, I. (2012). Clima social escolar: Una escala de evaluación-escala de clima social escolar, ECLIS. Universitas Psychologica, 11(3), 803-813. https://doi.org/10.11144/Javeriana.upsy11-3.csee
Aron, A. M., y Milicic, N. (1995). Resiliencia y clima social en el contexto escolar. Psykhe, 4(1), 57-68. http://rchd.uc.cl/index.php/psykhe/article/view/20233
Barksdale, C., Peters, M. L., & Corrales, A. (2021). Middle school students’ perceptions of classroom climate and its relationship to achievement. Educational Studies, 47(1), 84-107. https://doi.org/10.1080/03055698.2019.1664411
Bear, G., Yang, C., Mantz, L., Pansipanodya, E., Hearn, S., & Boyer, D. (2014). Technical manual for the delaware school survey. Newark, DE: Funded by the Delaware Positive Behavior Support Project at the Center for Disability Studies at University of Delaware and Delaware Department of Education. http://www.delawarepbs.org/wp-content/uploads/2011/12/Delaware-School-Survey-Technical-Manual-Fall-2016.pdf
Berkowitz, R. (2021). School climate and the socioeconomic literacy achievement gap: Multilevel analysis of compensation, mediation, and moderation models. Children and Youth Services Review, 130, 1-10. https://doi.org/10.1016/j.childyouth.2021.106238
Brand, S., Felner, R., Shim, M., Seitsinger, A., & Dumas, T. (2003). Middle School Improvement and Reform: Development and Validation of a School-Level Assessment of Climate, Cultural Pluralism, and School Safety. Journal of Educational Psychology, 95(3), 570-588. http://doi.org/10.1037/0022-0663.95.3.570
Buckman, D. G., Hand, N. W., & Johnson, A. (2021). Improving high school graduation through school climate. NASSP Bulletin, 105(1), 5-24. https://doi.org/10.1177/0192636521993212
Cohen, J., Pickeral, T., & McCloskey, M. (2009). Assessing School Climate. The Education Digest, 74(8), 45-48. https://www.proquest.com/magazines/assessing-school-climate/docview/218196384/se-2?accountid=37045
Council, N. S. C. (2007). The school climate challenge: Narrowing the gap between school climate research and school climate policy, practice guidelines and teacher education policy. Retrieved on. https://schoolclimate.org/wp-content/uploads/2021/05/school-climate-challenge-web.pdf
Djigic, G., & Stojiljkovic, S. (2011). Classroom management styles, classroom climate and school achievement. Procedia-Social and Behavioral Sciences, 29, 819-828. https://doi.org/10.1016/j.sbspro.2011.11.310
Ferrando, P. J. y Anguiano-Carrasco, C. (2010). El análisis factorial como técnica de investigación en psicología. Papeles del psicólogo, 31(1), 18-33. https://www.papelesdelpsicologo.es/pdf/1793.pdf
Ferrando, P. J. y Lorenzo-Seva, U. (2014). El análisis factorial exploratorio de los ítems: algunas consideraciones adicionales. Anales de Psicología / Annals of Psychology, 30(3), 1170-1175. https://doi.org/10.6018/analesps.30.3.199991
Galván, M. V. T. (2015). Health Sciences student’s perception of faculty attitudes and the impact on the learning climate. Revista Complutense de Educación, 26(2), 275-293. https://doi.org/10.5209/rev_RCED.2015.v26.n2.43028
García, A., Andrade, P. y Calleja, N. (2022). Validación de una Escala para evaluar Clima Escolar en estudiantes Universitarios (ECE-U). Informes Psicológicos, 22(1), 267-280. https://doi.org/10.18566/infpsic.v22n1a16
Green, S. B., & Yang, Y. (2009). Reliability of summed item scores using structural equation modeling: An alternative to coefficient alpha. Psychometrika, 74(1), 155-167. https://doi.org/10.1007/s11336-008-9099-3
Izquierdo, I., Olea, J., & Abad, F. J. (2014). Exploratory factor analysis in validation studies: Uses and recommendations. Psicothema, 26(3), 395-400. https://doi.org/10.7334/psicothema2013.349
Juárez, M. (2014). Estudio exploratorio del clima escolar universitario. (Tesis doctoral). Universidad Iberoamericana León. http://hdl.handle.net/11117/1428
Kaur, M., Sidhu, T. K., Mahajan, R., & Kaur, P. (2021). Evaluation of the Institutional Educational Environment by using the Dundee Ready Educational Environment Measure. International Journal of Applied and Basic Medical Research, 11(2), 85-89. https://doi.org/10.4103/ijabmr.IJABMR_470_20
Kohl, D., Recchia, S., & Steffgen, G. (2013). Measuring school climate: An overview of measurement scales. Educational Research, 55(4), 411-426. https://doi.org/10.1080/00131881.2013.844944
Krupat, E., Borges, N. J., Brower, R. D., Haidet, P. M., Schroth, W. S., Fleenor, T. J., & Uijtdehaage, S. (2017). The Educational Climate Inventory: Measuring Students’ Perceptions of the Preclerkship and Clerkship Settings. Academic Medicine, 92(12), 1757-1764. http://doi.org/10.1097/ACM.0000000000001730
Kutsyuruba, B., Klinger, D. A., & Hussain, A. (2015). Relationships among school climate, school safety, and student achievement and well-being: A review of the literature. Review of Education, 3(2), 103-135. http://doi.org/10.1002/rev3.3043
Ledesma, R. D., Ferrando, P. J. y Tosi, J. D. (2019). Uso del Análisis Factorial Exploratorio en RIDEP. Recomendaciones para autores y revisores. Revista Iberoamericana de Diagnóstico y Evaluación–e Avaliação Psicológica, 52(3), 173-180. https://doi.org/10.21865/RIDEP52.3.13
Lee, V. E., & Burkam, D. T. (2003). Dropping Out of High School: The Role of School Organization and Structure. American Educational Research Journal, 40(2), 353-393. https://doi.org/10.3102/00028312040002353
Lenz, A. S., Rocha, L., & Aras, Y. (2020). Measuring school climate: A systematic review of initial development and validation studies. International Journal for the Advancement of Counselling, 43(1), 48-62. https://doi.org/10.1007/s10447-020-09415-9
Lloret-Segura, S., Ferreres-Traver, A., Hernández-Baeza, A. y Tomás-Marco, I. (2014). El análisis factorial exploratorio de los ítems: una guía práctica, revisada y actualizada. Anales de Psicología/Annals of Psychology, 30(3), 1151-1169. https://doi.org/10.6018/analesps.30.3.199361
Loza, L. J., Vigueras, A. M. R. y Medina, E. V. (2020). Sentido de pertenencia y percepción del clima social universitario. Binomio clave en la construcción de la comunidad universitaria lasallista. En J. Brand (Ed.), Memoria del XX encuentro de formación docente: Verano de 2020 (pp. 359-371). Editorial Parmenia: De la Salle ediciones. https://editorialparmenia.com.mx/pub/media/wysiwyg/pdf/E%20Memoria%20del%20XX%20Encuentro%20de%20formacion%20docente%20311220.pdf
National School Climate Council. (2007). The school climate challenge: Narrowing the gap between school climate research and school climate policy, practice guidelines and teacher education policy. https://acortar.link/wBywOk
Nishimura, T., Wakuta, M., Tsuchiya, K. J., Osuka, Y., Tamai, H., Takei, N., & Katayama, T. (2020). Measuring School Climate among Japanese Students-Development of the Japan School Climate Inventory (JaSC). International Journal of Environmental Research and Public Health, 17(12), 1-11. https://doi.org/10.3390/ijerph17124426
O’Malley, M., Voight, A., Renshaw, T. L., & Eklund, K. (2015). School climate, family structure, and academic achievement: A study of moderation effects. School Psychology Quarterly, 30(1), 142-157. https://doi.org/10.1037/spq0000076
Pereira, Z. (2010). Las dinámicas interactivas en el ámbito universitario: el clima de aula. Revista Electrónica Educare, 14, 7-20. https://doi.org/10.15359/ree.14-Ext.1
Pere-Joan, F., & Anguiano-Carrasco, C. (2010). El análisis factorial como técnica de investigación en psicología. Papeles del psicólogo, 31(1), 18-33. https://www.redalyc.org/pdf/778/77812441003.pdf
Ríos, D., Bozzo, N., Marchant, J. y Fernández, P. (2010). Factores que inciden en el clima de aula universitario. Revista Latinoamericana de Estudios Educativos, 40(3-4), 105-126. https://rlee.ibero.mx/index.php/rlee/article/view/341/897
Roby, D. E. (2011). Teacher leaders impacting school culture. Education, 131(4), 782-790. http://www.timeforjapanese.com/media/downloads/research/Roby,%20TEACHER%20LEADERS%20IMPACTING%20SCHOOL%20CULTURE.pdf
Rodríguez-Pineda, M. y Zamora-Araya, J. A. (2021). Abandono temprano en estudiantes universitarios: Un estudio de cohorte sobre sus posibles causas. Uniciencia, 35(1), 19-37. https://doi.org/10.15359/ru.35-1.2
Shukla, K. D., Waasdorp, T. E., Lindstrom Johnson, S., Orozco Solís, M. G., Nguyen, A. J., Rodrı́guez, C. C. & Bradshaw, C. P. (2019). Does school climate mean the same thing in the United States as in Mexico? A focus on measurement invariance. Journal of Psychoeducational Assessment, 37(1), 55-68. https://doi.org/10.1177/0734282917731459
Smith, T. K., Connolly, F. & Pryseski, C. (2014). Positive School Climate: What It Looks Like and How It Happens Nurturing Positive School Climate for Student Learning and Professional Growth. Baltimore Education Research Consortium. https://files.eric.ed.gov/fulltext/ED553170.pdf
Sudla, W., Wongwanich, S., & Sriklaub, K. (2020). Development of School Climate Scale Based on School Members’ Shared Experiences. The Journal of Behavioral Science, 15(1), 52-72. https://so06.tci-thaijo.org/index.php/IJBS/article/view/202339
Walankar, P., Panhale, V., & Situt, S. (2019). Students’ Perceptions of the Educational Environment in an Indian Physiotherapy College. The Internet Journal of Allied Health Sciences and Practice, 17(2), 1-9. http://doi.org/10.46743/1540-580X/2019.1807
Wang, M.-T., & Degol, J. L. (2016). School climate: A review of the construct, measurement, and impact on student outcomes. Educational Psychology Review, 28(2), 315-352. https://doi.org/10.1007/s10648-015-9319-1
Zullig, K. J., Koopman, T. M., Patton, J. M., & Ubbes, V. A. (2010). School climate: Historical review, instrument development, and school assessment. Journal of Psychoeducational Assessment, 28(2), 139-152. https://doi.org/10.1177/0734282909344205
1* Autor para correspondencia
José Andrey Zamora-Araya,  jzamo@una.ac.cr,
  http://orcid.org/0000-0001-6050-5850
Karolayn Duarte-Abarca, karolayn.duarte.abarca@est.una.ac.cr, https://orcid.org/0000-0001-8666-6433
Darcy Quesada-Varela, darcy.quesada.varela@est.una.ac.cr, https://orcid.org/0000-0003-2199-7295
Mónica Prado-Abarca, monica.prado.abarca@est.una.ac.cr, https://orcid.org/0000-0003-1783-6763
Escuela de Matemática, Universidad Nacional, Heredia, Costa Rica.
Analysis of the School Climate Scale in University Environments (ECEAU) (José Andrey Zamora-Araya • Karolayn Duarte-Abarca • Darcy Quesada-Varela • Mónica Prado-Abarca) Uniciencia is protected by Attribution-NonCommercial-NoDerivs 3.0 Unported (CC BY-NC-ND 3.0)
URL: www.revistas.una.ac.cr/uniciencia
Correo electrónico: revistauniciencia@una.cr